
A suppressed EPA study says old U.N. data ignore the decline in global temperatures and other inconvenient truths. Was the report kept under wraps to influence the vote on the cap-and-trade bill?
This was supposed to be the most transparent administration ever. Yet as the House of Representatives prepared to vote on the Waxman-Markey bill, the largest tax increase in U.S. history on 100% of Americans, an attempt was made to suppress a study shredding supporters' arguments.
On Friday, the day of the vote, the Competitive Enterprise Institute said it was releasing "an internal study on climate science which was suppressed by the Environmental Protection Agency."
In the release, the institute's Richard Morrison said "internal EPA e-mail messages, released by CEI earlier in the week, indicate that the report was kept under wraps and its author silenced because of pressure to support the administration's agenda of regulating carbon dioxide."
Reading the report, available on the CEI Web site, we find this "endangerment analysis" contains such interesting items as: "Given the downward trend in temperatures since 1998 (which some think will continue until at least 2030), there is no particular reason to rush into decisions based on a scientific hypothesis that does not appear to explain most of the available data."
What the report says is that the EPA, by adopting the United Nations' 2007 "Fourth Assessment" report, is relying on outdated research by its Intergovernmental Panel on Climate Change (IPCC). The research, it says, is "at best three years out of date in a rapidly changing field" and ignores the latest scientific findings.
Besides noting the decline in temperatures as CO2 levels have increased, the draft report says the "consensus" on storm frequency and intensity is now "much more neutral."
Then there's one of Al Gore's grim fairy tales — the melting of the Greenland ice sheet and glaciers the size of Tennessee roaming the North Atlantic. "The idea that warming temperatures will cause Greenland to rapidly shed its ice has been greatly diminished by new results indicating little evidence for operations of such processes," the report says.
Little evidence? Outdated U.N. research? No reason to rush? This is not what the Obama administration and House Speaker Nancy Pelosi were telling us when they were rushing to force a Friday vote on Waxman-Markey. We were given the impression that unless we passed this cap-and-tax fiasco, polar bears would be extinct by the Fourth of July.
We have noted frequently the significance of solar activity on earth's climate and history. This EPA draft report not only confirms our reporting but the brazen incompetence of those "experts" that have been prophesying planetary apocalypse.
"A new 2009 paper by Scafetta and West," the report says, "suggests that the IPCC used faulty solar data in dismissing the direct effect of solar variability on global temperatures. Their report suggests that solar variability could account for up to 68% of the increase in Earth's global temperatures."
The report was the product of Alan Carlin, senior operations research analyst at the EPA's National Center for Environmental Economics (NCEE). He's been with the EPA for 38 years but now has been taken off all climate-related work. He is convinced that actual climate observations do not match climate change theories and that only the politics, not the science, has been settled.
Thomas Fuller, environmental policy blogger with the San Francisco Examiner, wrote Thursday in a story developed in conjunction with Anthony Watts' Web site wattsupwiththat.com: "A source inside the Environmental Protection Agency confirmed many of the claims made by analyst Alan Carlin, the economist/physicist who yesterday went public with accusations that science was being ignored in evaluating the danger of CO2."
All this is particularly interesting because of the charges by Al Gore, NASA's James Hansen and others that the Bush administration and energy companies actively suppressed the truth about climate change.
One of the e-mails unearthed by CEI was dated March 12, from Al McGartland, office director at NCEE, forbidding Carlin from speaking to anyone outside NCEE on endangerment issues such as those in his suppressed report.
Carlin replied on March 16, requesting that his study be forwarded to EPA's Office of Air and Radiation, which directs EPA's climate change program. Carlin points out the peer-reviewed references in his study and points out that the new studies "explain much of the observational data that have been collected which cannot be explained by the IPCC models."
For saying the climate change emperors had no clothes, Carlin was told March 17: "The administrator and the administration have decided to move forward on endangerment, and your comments do not help the legal or policy case for this decision. . . . I can only see one impact of your comments given where we are in the process, and that would be a very negative impact on our office."
In other words, the administration and Congress had their collective minds made up and didn't want to be confused with the facts. They certainly didn't want any inconvenient truths coming out of their own Environmental Protection Agency, the one that wants to regulate everything from your lawn mower to bovine emissions and which says the product of your respiration and ours, carbon dioxide, is a dangerous pollutant and not the basis for all life on earth.
The problem the warm-mongers have is they now are in a position of telling the American people, who are you going to believe — us or your own lying eyes? Forget the snow in Malibu, the record cold winters. Forget that temperatures have dropped for a decade.
In April, President Obama declared that "the days of science taking a back seat to ideology are over." Apparently not, for as he spoke those very words his administration was suppressing science to advance a very pernicious ideology.
SOURCE
Monckton summarizes the skeptical case
The warming effect of greenhouse gases is less than one-tenth the UN's central estimate.
Spencer et al. (2008, cloud albedo); Douglass (2008, tropical mid-troposphere temperature change); Lindzen & Choi (2009 in press, outgoing long-wave radiation); and Armstrong, Green & Soon (2009 in press, zero-change benchmarking of climate forecasts) empirically confirm theoretical demonstrations (Schwartz, 2007; Monckton, 2008; Monckton & Evans, 2009 in draft) that climate sensitivity - the warming effect of all greenhouse gases, not just of CO2 - is less than one-fourth of the UN's current central estimate. A CO2 doubling would cause just 1.5 Fø warming, not the 5.9 Fø imagined by the UN.
`Global warming' is nothing new.
It was 10 Fø warmer than today in each of the past four interglacial periods; 2-3 Fø warmer for most of the past 10,000 years; warmer in the Minoan, medieval, and Roman warm periods. The rate of warming is nothing new either: the warming rate equivalent to 2.9 Fø/century from 1975-1998, when humankind might have had a small influence, was exactly the same as the warming rates from 1860-1880 and from 1910-1940 (House of Lords Written Answer, 2009).
There has been no statistically-significant `global warming' for almost 15 years.
In fact, for almost eight years, on all measures, there has been global cooling at 3.4 Fø/century. Oceans have also been cooling ever since 3300 automated bathythermographs were deployed in 2005. The ocean cooling definitively proves the UN wrong about "global warming": if there were any, 80% of it would have to show up in the top 400 fathoms of the world's oceans, but it is not happening. It follows that all recent reports that "global warming" has caused adverse weather events must be incorrect, because there has not been any. The UN's central estimate, on its "business-as-usual" scenario, is for 6 Fø warming in the 21st century, but in the 30 years since accurate satellite temperatures became available in 1980 the warming rate has averaged just 2.7 Fø/century - less than half the UN's prediction.
CO2 concentration is rising at less than half the UN's predicted rate.
The UN's central estimate is that CO2 concentration will grow exponentially to reach 836 parts per million by volume this century, but in fact it is growing linearly towards just 575 ppm. This factor alone demands a halving of all UN temperature predictions. Methane concentration stopped rising in 2000 and has hardly changed since.
Contrary to reports, the climate is doing just fine:
Global Sea-ice Extent A steady heartbeat for 30 years.
Arctic Sea Ice Normal in winter, down a little in recent summers, but well within natural variability.
Arctic Temperature Warmer in the 1930s and early 1940s than today.
North-West Passage Amundsen sailed through it in 1903. It was also open in the mid-1940s.
Greenland Mean ice-sheet thickness grew by 2 in/yr from 1993-2003 (Johannessen et al., 2005).
Polar Bears Population up fivefold since the 1940s.
Antarctic Sea Ice Growing for 30 years.
Antarctic Temperature Little change in 50 years.
Antarctic Peninsula Ice-shelves about 1/55 the area of Texas have gone, but were not there in the Middle Ages.
Sahara Desert Greening so fast that 300,000 km2 has become vegetated, allowing nomadic tribes to settle where they haven't been seen in living memory.
Droughts and Floods Variable as usual. Hurricanes and Other Tropical Cyclones Lowest activity for 30 years.
Sea Level Rising at 1 ft/century since satellite measurements began in 1993, compared with average 4 ft/century over the past 10,000 years. No sea-level rise in the last three years. UN High-end Forecast Slashed from 3ft to <2ft sea-level rise by 2100: UN best current estimate 1 ft 5 in.
Bangladesh Has gained 70,000 km2 land area confounding UN sea-level forecasts.
Pacific Atolls Not at risk: corals can grow towards the light at 10x the rate of sea-level rise, which is why so many atolls are just above sea level.
Maldives No sea-level rise in 1250 years (Morner, 2004).
Ocean acidification is a scientific impossibility. Henry's Law mandates that warming oceans will outgas CO2 to the atmosphere (as the UN's own documents predict it will), making the oceans less acid. Also, more CO2 would increase calcification rates. No comprehensive, reliable measurement of worldwide oceanic acid/base balance has ever been carried out: therefore, there is no observational basis for the computer models' guess that acidification of 0.1 pH units has occurred in recent decades.
There is no economic case for costly measures to mitigate greenhouse-gas emissions. To prevent 1 Fø of warming, 1-10 trillion tons of CO2 emission would have to be foregone - the equivalent of shutting down the entire US economy for 170-1700 years. The Waxman/Markey Climate Bill would cost $160 billion/year (White House estimate) and, even if implemented fully, would cool the climate by just 0.0005-0.005 Fø/yr.
Secretary Chu's grand plan to paint the world white would cool the climate 0.2 Fø at the very most, at a cost of $200 trillion.
Overtaxing & overregulating US fossil-fuel industries would increase the world carbon footprint. Not that the carbon footprint matters (see point 1). However, if the US kills its own fossil-fuel industry, US corporations and jobs will move to China and other third-world economies, where carbon emissions per unit of output are higher than in the US. China and India will not be cutting their emissions
SOURCE
THIS COULD NEVER HAPPEN TO CLIMATE MODELLERS, COULD IT?
American researchers say they have uncovered a mathematical mistake made by the dinosaur boffinry community, meaning that the weight of live dinos has long been massively overestimated. In a development with devastating consequences for various much-fancied works of fiction, it now appears that in fact the dinosaurs were significantly slenderer than had been thought.
"Paleontologists have for 25 years used a published statistical model to estimate body weight of giant dinosaurs. By re-examining data in the original reference sample, we show that the statistical model is seriously flawed," says Gary Packard of Colorado State University.
SOURCE
Sun spot cycle impacting global warming and cooling
The sun has been very quiet, with a decreasing number of sunspots and flarings since January 2002, and predictions of a return to the higher cycle seen at the end of the 20th century have not verified. But there have been some recent signs of increased sunspots as of early to mid June, but it's too soon to tell if it will prove meaningful.
The calm on the surface of the sun ultimately will have some say in the course of weather across the Earth. For one, if the sunspot pattern does not revitalize soon, and continues for the next few months or years, it is conceivable that a more volatile pattern of trough formation and cold intrusions could occur, with the polar ice caps undergoing some growth and global sea surface temperatures less prone to rise in critical areas.
For instance, with an emerging El Nino the lack of solar energy influx may provide a critical boost of equatorial SSTs from going into the "strong" +ENSO designation. A weak to moderate El Nino episode, against what appears to be a neutral PDO configuration, may mean better capacity for -EPO and +PNA ridge development against an invigorated storm track running close to 30 N Latitude.
That, in combination with better-organized snow and ice fields in northern Canada, may well mean that the character of the upcoming autumn and winter could be far different (yes, longer-lasting and more frequent cold advection cases) than the past three NDJFM periods. The sun has been very quiet, with a decreasing number of sunspots and flarings since January 2002.
An active sun outputs a little more energy, more ultraviolet, which cause warming in the atmosphere through ozone chemistry, and through the diffusion of galactic cosmic rays, which normally cause increased low clouds through ion-mediated nucleation. Fewer cosmic rays mean fewer clouds, more sun. The opposite happens when the sun is quiet as it has been the last few years.
The sun has become more active so far in June with cycles 24 spots in middle latitudes.
This has been an unusual cycle. In 2003 and as late as 2006, NASA was expecting a start to the new cycle in December 2006 and a big cycle 24 peaking in 2010 or 2011. In subsequent releases by NASA, the new cycle was pushed back and estimates for the amplitude decreased.
On Sept. 23, 2008, in a briefing at NASA headquarters, solar physicists announced that the solar wind is losing power. "The average pressure of the solar wind has dropped more than 20% since the mid-1990s," says Dave McComas of the Southwest Research Institute in San Antonio, Texas. "This is the weakest it's been since we began monitoring solar wind almost 50 years ago."
This activity came late enough in the month of May, to keep the monthly number for May below the value of 14 months ago of 3.2 that it is replacing in the 13-month running mean. That means the solar cycle minimum can’t be earlier than November 2008, making it at least a 12.5 year long cycle 23. This is about two years later than the early estimates of the solar minimum.
The value needs to fall below 3.4 in June to move the minimum to December. That is still possible if the sunspot group continues to decay as most have done as they crossed the disk in recent months. If it stays below that value, we will likely see the solar minimum in December 2008 as 14 months before that the sun was very quiet with just a sunspot number of 0.5. If not, the minimum will be November.
We added 22 more sun spotless days to the total for this cycle transition, which as of June 1 had now reached an amazing 614 days. We are likely to add additional days and add 2009 to 2007 and 2008 as recent years in the top ten since 1900. Only the early 1900s had a similar 3-year stretch of high sunspot days (1911, 1912, and 1913).
It also marks the longest cycle in 150 years, tying the one that peaked in 1848. You have to go back to the Dalton minimum in 1816 to find a longer cycle 12.7 years. In 3 of the 5 most recent cycles, the sun had rebounded significantly by years 12 and 13 well into the next cycle.
Theodore Landscheidt in New Ice Age Instead of Global Warming warned the decline could continue in solar activity until a Maunder Minimum like level was reached about 2030.
The Russians appear to agree. Khabibullo Abdusamatov of the Russian Academy of Science said he and his colleagues had concluded that a period of global cooling similar to one seen in the late 17th century - when canals froze in the Netherlands and people had to leave their dwellings in Greenland - could start in 2012-2015 and reach its peak in 2055-2060.
The late Rhodes Fairbridge of Columbia University had found with the help of NASA and the JPL, every 179 years or so, the sun embarks on a new cycle of orbits. One of the cooler periods in recent centuries was the Little Ice Age of the 17th century, when the Thames River in London froze over each winter. The next cool period, if the pattern holds, began in 1996, with the effects to be felt starting in 2010. Some predict three decades of severe cold..
Clilverd et al (2006) in a paper “Predicting Solar Cycle 24 and Beyond” found by using an harmonic analysis of the multiple cycle frequencies of solar cycles in a model that correctly has caught the activity the past 250 years with a sunspot number standard deviation of 34. Their analysis suggest cycles 24 and 25 will be the lowest (quietest and thus coolest) in nearly 200 years. The two cycles should be like those of the Dalton Minimum.
Much will be learned the next 5-15 years if the solar cycle decline with cooling temperatures continues. Past studies have shown that sunspot numbers correspond to warming or cooling trends. The twentieth century has featured heightened activity, indicating a warming trend.
Solar activity has shown a major spike in the twentieth century, corresponding to global warming. This cyclic variation was acknowledged by a recent NASA study, which reviewed a great deal of past climate data. The report indicates solar cycles have been impacting Earth since the Industrial Revolution.
Some researchers believe that the solar cycle influences global climate changes. They attribute recent warming trends to cyclic variation. Skeptics, though, argue that there's little hard evidence of a solar hand in recent climate changes.
A new research study from NASA’s Goddard Space Flight Center in Greenbelt, Maryland looking at climate data over the past century has concluded that solar variation has made a significant impact on the Earth's climate. The report concludes that evidence for climate changes based on solar radiation can be traced back as far as the Industrial Revolution.
Past research has shown that the sun goes through eleven-year cycles. At the cycle's peak, solar activity occurring near sunspots is particularly intense, basking the Earth in solar heat. According to Robert Cahalan, a climatologist at the Goddard Space Flight Center, "Right now, we are in between major ice ages, in a period that has been called the Holocene."
Thomas Woods, solar scientist at the University of Colorado in Boulder concludes, "The fluctuations in the solar cycle impacts Earth's global temperature by about 0.1 degree Celsius, slightly hotter during solar maximum and cooler during solar minimum. The sun is currently at its minimum, and the next solar maximum is expected in 2012."
According to the study, during periods of solar quiet, 1,361 watts per square meter of solar energy reaches Earth's outermost atmosphere. Periods of more intense activity brought 1.3 watts per square meter (0.1 percent) more energy.
While the NASA study acknowledged the sun's influence on warming and cooling patterns, however it concluded that man had replaced the sun as the primary cause of current warming patterns.
NASA's own new study acknowledges that solar variation has caused climate change in the past. I don’t know any scientists who disagree with that fact. And even the study's members, mostly ardent supports of AGW theory, acknowledge that the sun may play a significant role in future climate changes. Peer reviewed papers are necessary since it allows the two sides to debate the science and not the politics. Both sides claim flaws in the others methods and/or data. This ongoing process is healthy, as I doubt either side has all the answers. As I said in my global warming position paper a few years ago, we may not have to wait more than 10-15 years for indications of which side is right, the AGW side or the sun and ocean side. Both have made predictions, time will tell.
SOURCE
Forest owners stand to win big in climate bill
For years, landowners have gotten paid for not farming. Now they may get paid for not cutting down trees. While U.S. families could see their annual energy bills rise hundreds of dollars under a massive climate bill that President Barack Obama and congressional Democrats are trying to push through the House, owners of large swaths of forestland — timber companies, large farms, even foreign countries — could reap billions of dollars.
The bill is aimed at curbing the gases, largely carbon dioxide from power plants and vehicles, blamed for global warming. But it would allow polluters to buy credits from owners of forestland as an alternative to switching to fuels other than coal and gas or installing expensive equipment to capture the greenhouse gases. The land owners would get the credits because trees suck up greenhouse gases, preventing them from reaching the atmosphere and acting like a blanket to warm the Earth.
The premise is that at some point, the sources of greenhouse gases will find it cheaper to switch to other fuels or install pollution controls than to keep paying for the credits. "In effect, the public is going to pay polluters to plant trees," says Frank O'Donnell of the advocacy group Clean Air Watch. "Does that really lead to a major improvement in global warming? I don't know and I'm not sure anybody knows."
Calculating carbon. Here's how it works, hypothetically: Say an acre of forestland sucks up two additional metric tons of carbon after a landowner plants more trees on his land or promises to rotate the way he cuts them down so more are standing at once. If the pollution market created by the legislation is currently trading at $20 a ton, then the landowner could stand to make $40 per acre if he qualifies for the program — a potentially good investment for owners of thousands of acres of forest, such as timber companies or large corporate farms.
The legislation would also extend to international forests, promising to pay some countries that agree to slow their harvesting of trees abroad. The Agriculture Department, which includes the U.S. Forest Service, will oversee the domestic program and develop regulations for verifying whether a forest owner's particular tract of land is actually capturing carbon. Farm state lawmakers had threatened to vote against the bill if the Environmental Protection Agency was given that authority. Rep. Collin Peterson, the Minnesota Democrat who led the fight to include the offsets for forests and other agricultural programs, said many farmers don't trust the EPA.
The program is not unlike another set of payments that many farmers have been receiving for years — conservation subsidies that pay farmers not to plant on environmentally sensitive land. Farmers and foresters are also exempt from the bill's greenhouse gas emission reduction requirements under the bill.
SOURCE
More Telling Tall Tales With Trends
This post is from last year but well worth repeating for the light it shines on the darkness at the heart of Warmism
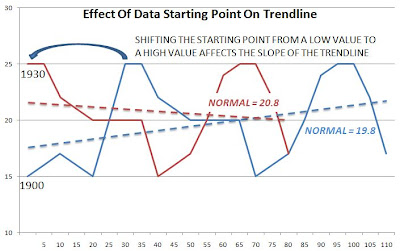
This Spring, I pointed out a couple of times [here and here] that the inherent flaw in the Global Warming argument was the selection of an unusually low temperature period as a starting point. This results in an upward overall linear trend for all conditions. It is this "cherry picking" of historical data that allows alarmists to make "startling" comments that earth's temperature has increased by about 1° F over more than a century. This chart was used to illustrate the phenomenon:
Now a post at Icecap by George Taylor, CCM, points out another tall tale using trends. This time, the starting point was from an exceptionally snowy period so that a return to a more normal period would be seen as a dramatic reduction of snow cover in the Northwest.
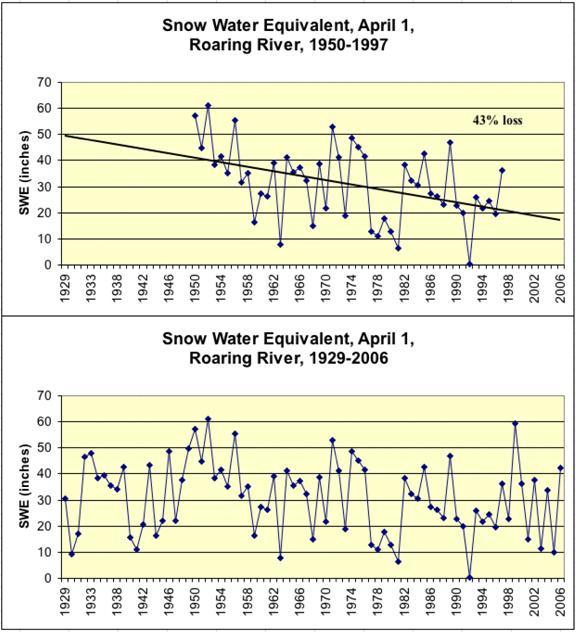
The top chart was used to "prove" that global warming was causing a dramatic reduction in snow cover. The bottom chart shows the "unabridged" version. Where's Waldo? The Machiavellian approach of alarmists is obvious: the end [proving global warming] justifies the means [deception and deceit].
SOURCE (See the original for links)
***************************************
For more postings from me, see DISSECTING LEFTISM, TONGUE-TIED, EDUCATION WATCH INTERNATIONAL, POLITICAL CORRECTNESS WATCH, FOOD & HEALTH SKEPTIC, GUN WATCH, SOCIALIZED MEDICINE, AUSTRALIAN POLITICS, IMMIGRATION WATCH INTERNATIONAL and EYE ON BRITAIN. My Home Pages are here or here or here. Email me (John Ray) here. For readers in China or for times when blogger.com is playing up, there is a mirror of this site here.
*****************************************


 Jim Hansen and his twin


No comments:
Post a Comment